Statistical Tables | | It's All About Patience
| Trends at a Glance | |||
| (Single-family Homes) | |||
| Jun 25 | May 25 | Jun 24 | |
| Home Sales: | 217 | 213 | 191 |
| Median Price: | $1,706,000 | $1,800,000 | $1,631,000 |
| Average Price: | $2,131,390 | $2,419,057 | $2,120,119 |
| SP/LP: | 108.8% | 106.9% | 109.1% |
| Days on Market: | 20 | 21 | 29 |
| (Lofts/Townhomes/TIC) | |||
| Jun 25 | May 25 | Jun 24 | |
| Condo Sales: | 231 | 223 | 169 |
| Median Price: | $1,150,000 | $1,249,000 | $1,098,000 |
| Average Price: | $1,255,290 | $1,365,698 | $1,282,903 |
| SP/LP: | 98.2% | 98.2% | 99.2% |
| Days on Market: | 56 | 44 | 43 |
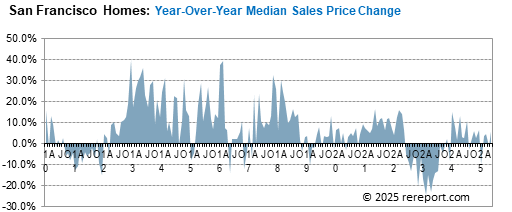
The median sales price for single-family, re-sale homes was up 4.6%
year-over-year.
The average sales price for single-family, re-sale homes was down 11.9%
month-over-month. Year-over-year, it was up 0.5%.
Sales of single-family, re-sale homes rose 13.6% year-over-year. There were 217
homes sold in San Francisco last month. The average since 2000 is 214.
The median sales price for
condos/lofts
was up 4.7% year-over-year.
The average sales price was down 2.2% year-over-year.
Sales of
condos/lofts
rose 36.7% year-over-year. There were 231
condos/lofts
sold last month. The average since 2000 is 230.
The sales price to list price ratio, or what buyers are paying over what sellers
are asking, rose from 106.9% to 108.8% for homes. The ratio for condos/townhomes
stayed at 98.2%.
Average days on market, or the time from when a property is listed to when it
goes into contract, was 20 for homes and 56 for condos/lofts.
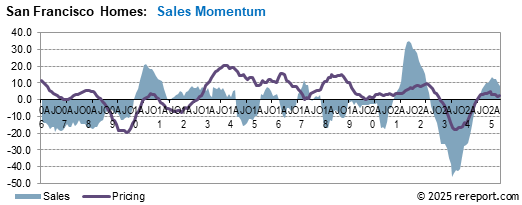
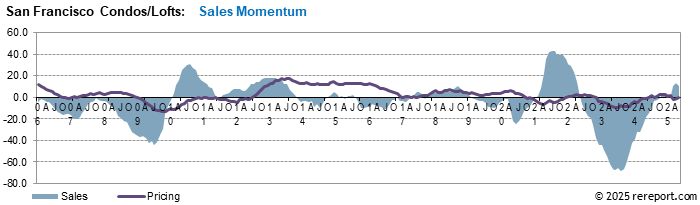
Sales momentum…
for homes rose from +8.3 to +10. Sales momentum for condos/lofts was up 3.7
points to +14.
Pricing momentum…
for single-family homes rose 0.2 of a point to +2.5.
Pricing momentum for condos/lofts rose 0.4 of a point to 0.
Our momentum statistics are based on 12-month moving averages to eliminate
monthly and seasonal variations.
If you are planning on selling your property, call me for a free comparative
market analysis.
momentum by using a 12-month moving average to eliminate seasonality. By comparing this year's 12-month moving average to last year's, we get a percentage showing market momentum.
the blue area shows momentum for home sales while the red line shows momentum for pending sales of single-family, re-sale homes. The purple line shows momentum for the average price.
As you can see, pricing momentum has an inverse relationship to sales momentum.
The graph below shows the median and average prices plus unit sales for homes.

Remember, the real estate market is a matter of neighborhoods and houses. No two are the same. For complete information on a particular neighborhood or property, call me.
P.S. The FHA requires all condo projects to be re-certified before they will make a loan. To find out if the condo project you're interested in is eligible, go here: https://entp.hud.gov/idapp/html/condlook.cfm.
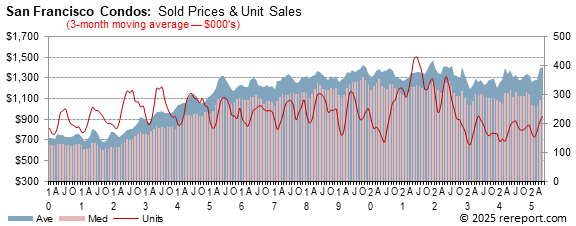
The graph below shows the median and average prices plus unit sales for condos/lofts.
The real estate market is very hard to generalize. It is a market made up of many micro markets. For complete information on a particular neighborhood or property, call me.
If I can help you devise a strategy, call or click the buying or selling link in the menu to the left.
Complete monthly sales statistics for San Francisco are below. Monthly graphs are available for each area in the city.
| June Sales Statistics | |||||||||||
| (Single-family Homes) | |||||||||||
| Prices | Unit | Yearly Change | Monthly Change | ||||||||
| Median | Average | Sales | DOM | SP/LP | Median | Average | Sales | Median | Average | Sales | |
| San Francisco | $1,706,000 | $2,131,390 | 217 | 20 | 108.8% | 4.6% | 0.5% | 13.6% | -5.2% | -11.9% | 1.9% |
| D1: Northwest | $2,579,750 | $2,624,128 | 20 | 7 | 114.0% | 20.1% | 0.4% | 66.7% | 12.9% | 2.4% | 25.0% |
| D2: Central West | $1,677,500 | $1,935,074 | 38 | 14 | 110.8% | 6.2% | 13.2% | -9.5% | 4.8% | 6.8% | 8.6% |
| D3: Southwest | $1,500,000 | $1,528,183 | 15 | 17 | 116.2% | 39.5% | 24.6% | 150.0% | 25.0% | 10.7% | 66.7% |
| D4: Twin Peaks | $2,200,000 | $2,362,414 | 33 | 19 | 113.2% | 5.3% | 6.4% | 22.2% | 10.0% | 14.5% | 32.0% |
| D5: Central | $2,700,000 | $2,835,434 | 33 | 22 | 106.5% | 8.0% | -0.4% | 6.5% | -9.1% | -6.3% | 22.2% |
| D6: Central North | $2,970,000 | $2,970,000 | 1 | 32 | 99.1% | 38.7% | 33.1% | -83.3% | -15.1% | -18.2% | -66.7% |
| D7: North | $4,995,000 | $5,499,286 | 7 | 20 | 96.3% | -3.9% | 7.0% | -30.0% | -16.8% | -39.1% | -22.2% |
| D8: Northeast | $1,895,000 | $1,895,000 | 1 | 59 | 95.0% | 26.3% | 8.3% | -66.7% | -60.2% | -62.3% | -75.0% |
| D9: Central East | $1,680,000 | $2,016,068 | 29 | 21 | 110.7% | 5.0% | 11.9% | 31.8% | -1.2% | 9.8% | 81.3% |
| D10: Southeast | $1,080,000 | $1,089,463 | 36 | 26 | 114.3% | -5.1% | -4.6% | 12.5% | -10.0% | -9.2% | 16.1% |
| June Sales Statistics | |||||||||||
| (Condos/TICs/Co-ops/Lofts) | |||||||||||
| Prices | Unit | Yearly Change | Monthly Change | ||||||||
| Median | Average | Sales | DOM | SP/LP | Median | Average | Sales | Median | Average | Sales | |
| San Francisco | $1,150,000 | $1,255,290 | 231 | 56 | 98.2% | 4.7% | -2.2% | 36.7% | -7.9% | -8.1% | 3.6% |
| D1: Northwest | $1,532,500 | $1,602,500 | 8 | 43 | 107.9% | 5.7% | -1.9% | -11.1% | -12.9% | -16.9% | -11.1% |
| D2: Central West | $1,041,720 | $1,101,720 | 4 | 32 | 102.0% | 10.1% | 16.4% | 100.0% | -26.9% | -22.7% | 300.0% |
| D3: Southwest | $880,000 | $880,000 | 2 | 12 | 125.8% | 16.2% | 5.3% | -33.3% | -20.7% | -20.7% | 0.0% |
| D4: Twin Peaks | $641,000 | $713,875 | 8 | 107 | 99.4% | -24.4% | -11.0% | 100.0% | -8.1% | -7.7% | 100.0% |
| D5: Central | $1,566,000 | $1,559,914 | 35 | 29 | 105.2% | 23.2% | 18.3% | 25.0% | -0.9% | -0.9% | 0.0% |
| D6: Central North | $1,190,000 | $1,258,959 | 29 | 40 | 102.3% | 3.5% | 6.1% | 93.3% | -6.3% | 8.5% | 26.1% |
| D7: North | $1,752,500 | $1,796,176 | 32 | 42 | 102.8% | 28.6% | -3.0% | 23.1% | 18.8% | -12.9% | 18.5% |
| D8: Northeast | $949,000 | $1,134,863 | 35 | 65 | 98.2% | -11.7% | -17.2% | 52.2% | 7.5% | -6.2% | -7.9% |
| D9: Central East | $1,025,000 | $1,166,209 | 59 | 85 | 99.0% | 24.2% | 14.2% | 31.1% | -6.8% | 1.4% | -21.3% |
| D10: Southeast | $577,500 | $570,700 | 5 | 85 | 108.3% | -30.0% | -39.0% | -44.4% | 19.1% | 17.7% | 400.0% |
June 27, 2025 --
Is May's mild uptick in inflation the beginning of things to come, bearing out
the Fed's stance of holding short-term rates steady for a while longer yet?
There's no simple way to know, and little to do but watch and wait to see the
outcome of the changes to trade and tariff policy. In his prepared remarks at
the semiannual monetary report to the Congress, Fed Chair Powell reiterated:
"For the time being, we are well positioned to wait to learn more about the
likely course of the economy before considering any adjustments to our policy
stance."
In his testimony, he suggested that if not for the injection of tariff and trade
uncertainty that Fed might have already been in a place where rate cuts were
possible. The Fed expects to see price pressures increasing as the summer moves
along, but "If it turns out that inflation pressures do remain contained, we
will get to a place where we cut rates sooner rather than later." Odds still
strongly favor a quarter-point cut in rates come September.
Nearly regardless of whatever the Fed may or may not do anytime soon, mortgage
rates remain at an elevated level, one they attained just a few weeks after the
Fed first began cutting rates for this cycle, and high mortgage rates continue
to stymie the housing market, keeping a lid on home sales.
Existing home sales did manage a slight increase in May, posting a 0.8% rise to
a 4.03 million annualized rate of sale, although this is virtually unchanged
from the last two months. A lack of affordability rather than a lack of
inventory is throttling sales, as the number of homes for sale continues to
rise. Currently, the 1.54 million units available -- 4.6 months of supply at the
present rate of sale -- is the highest inventory-to-sales ratio since August
2016 (leaving out May 2020, the first full "closure" month of the pandemic).
Despite more inventory, selling prices continue to press higher, with the median
sales price of $422,800 just a stone's throw from a record high. Given the
trend, it's a good possibility that we'll see a new record high price next
month, but increasing inventory and seasonal effects will likely see home price
declines start to show shortly thereafter.
The souring homebuilder moods we saw in last week's release of the NAHB's
Housing Market Index were given context this week. Sales of new homes slumped by
13.7% in May to a 623,000 annual pace, and that from a downwardly-revised 721K
sales pace in April. It may be that the whipsawing in stock markets in April and
continued uncertainty about the outlook into May kept folks from buying
newly-built homes, as other factors such as mortgage rates or builder incentives
really didn't change much. The drop in sales saw the new home inventory-to-sales
ratio balloon to 9.8 months of inventory available at the present rate of sale,
with the 507,000 actual units coming on line the highest number since October
2007. Housing starts declined by about 10% in May and if new home sales don't
rebound over the coming months, construction might need to be curtailed further
to allow some inventory drawdown. Median sales prices of new homes kicked higher
last month, with the $426,600 sticker roughly keeping pace with increases in the
existing home market.
The existing home market may yet see a little sales bump to start the summer,
provided the 1.8% increase in the National Association of Realtors Pending Home
Sales Index (PHSI) for May bears out. This measure of signed contracts typically
leads the sales tally by a month or two, so June's increase might be reflected
in July or August's sales figures. To the extent that this lag is two months, we
might yet have to get past a decline in sales for June, given April's
considerable decline from a stronger March pace. We'll just have to wait and
see.
This page is copyrighted by https://rereport.com. All rights are reserved.